

You stand up too fast, the edges of the room go gray for a second, and then everything snaps back. That one second is cardiovascular physiology in miniature. Gravity pulls blood into your legs, pressure at your head dips, a reflex fires, and your heart and vessels fix the problem before you've finished the thought.
Most students meet this topic as six separate chapters. It is one story, and you just lived through it.
Why does cardiovascular physiology feel like six topics?
Because textbooks slice it that way: cardiac cycle in one lecture, ECG in another, hemorrhage in a clinical session three weeks later. I spent most of first year memorizing each slice with a different color of highlighter, and nothing joined up until a viva examiner asked me one plain question: pressure in the aorta reads 120 over 80, so who made that pressure, and who keeps it there?
That question is the whole article.
Cardiovascular physiology explains how the heart builds pressure, how that pressure becomes flow, and how the body regulates both. The cardiac cycle generates pressure, cardiac output sets the flow, vascular resistance converts flow into blood pressure, reflexes correct errors, and the ECG records the electrical trigger behind each beat.
I wrote this as one unbroken chain so a first-year can follow it from the first heartbeat to a hard sprint, and a final-year can jump to the tables the night before a theory paper. Everything below hangs off a single line: . Mean arterial pressure equals cardiac output times total peripheral resistance, and each section either builds one side of that product or shows the body adjusting it.
Start where the pressure is born.
One heartbeat, five phases
Think of the left ventricle as a room with two doors. The mitral valve is the door in, the aortic valve is the door out, and neither has a handle. Pressure pushes them open and shut, so every phase of the cardiac cycle is really a statement about which side of each door has more pressure.
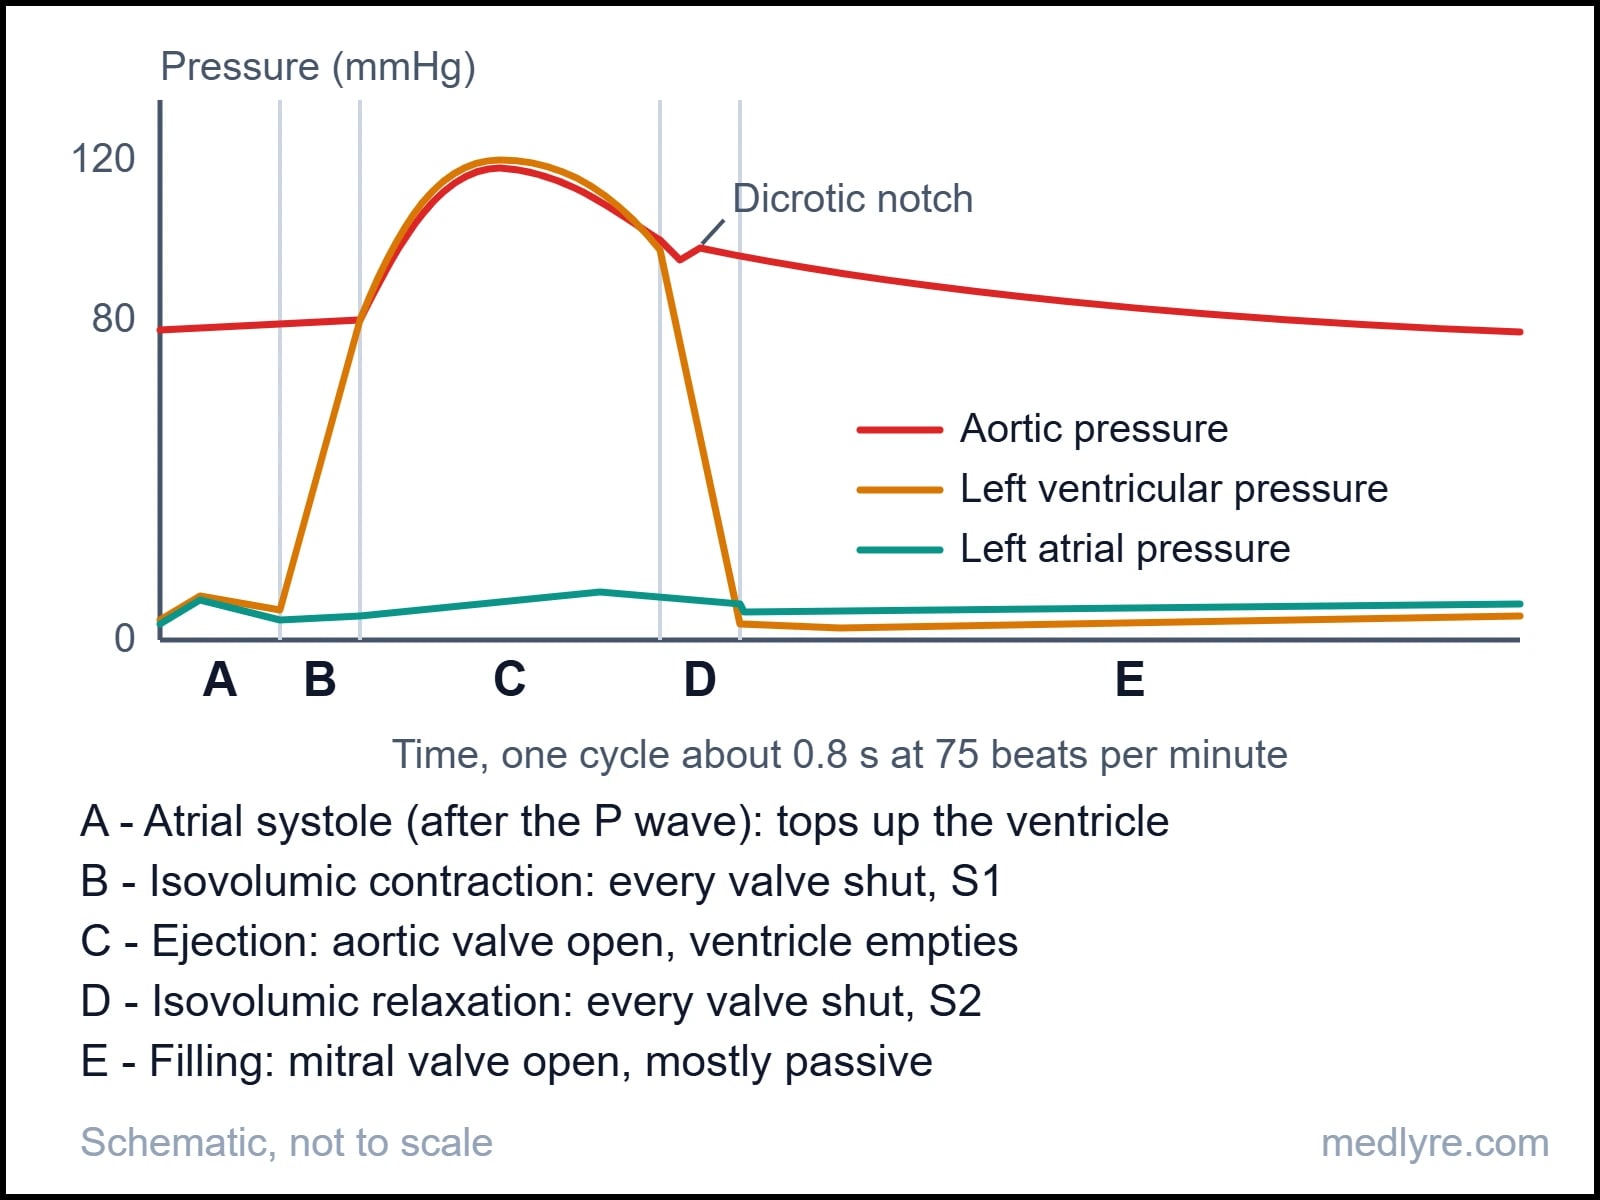
Follow the letters. In atrial systole (A), the P wave has fired the atria and they squeeze the last of their blood into a ventricle that is already mostly full. Guyton and Hall's physiology text puts that final top-up, the atrial kick, at roughly 20 percent of ventricular filling.
Then the ventricle takes over. Pressure inside it climbs past atrial pressure, the mitral valve slams shut, and that closure is the first heart sound, S1. The aortic valve stays shut as well, because aortic pressure still sits near 80 mmHg. Two closed doors, a fixed volume of blood, a muscle squeezing hard: that's isovolumic contraction (B), lasting only about 0.05 second. Pressure shoots up steeply and nothing moves.
The instant ventricular pressure beats aortic pressure, the aortic valve opens and ejection (C) begins. About 70 ml leaves, so the ventricle drops from an end-diastolic volume near 120 ml to an end-systolic volume near 50 ml. That is a stroke volume of 70 ml and an ejection fraction of roughly 60 percent, and Pollock and Makaryus describe a healthy ventricle ejecting more than 60 percent of its volume.
As the muscle relaxes, ventricular pressure falls below aortic pressure and the aortic valve closes. That's S2, and it leaves the small blip on the aortic curve called the dicrotic notch. Both doors are shut again while pressure drains away, which is isovolumic relaxation (D). When ventricular pressure sinks under atrial pressure the mitral valve opens, and filling (E) begins, fast at first and then slower.
| Phase | AV valves | Semilunar valves | ECG | Heart sound |
|---|---|---|---|---|
| A. Atrial systole | Open | Closed | P wave | S4 (usually abnormal in adults) |
| B. Isovolumic contraction | Closing, then shut | Shut | QRS | S1 |
| C. Ejection | Shut | Open | T wave (late) | None normally |
| D. Isovolumic relaxation | Shut | Closing, then shut | None | S2 |
| E. Filling | Open | Shut | None | S3 (normal in children, often abnormal in adults) |
Where students slip
Systole and diastole are named by the ventricular valves, not by the ECG. Systole runs from mitral closure to aortic closure, and diastole runs from aortic closure to the next mitral closure, as the same StatPearls chapter lays out. That is why S1 and S2 are the true bookmarks of the cycle. At no moment in the table are all four valves open.
The right ventricle runs the identical sequence at far lower pressure. Pulmonary artery pressure is about 25/10 mmHg against 120/80 in the aorta, so the right side moves the same stroke volume for roughly a fifth of the systolic pressure. The two ventricles sit in series, which means that over any stretch of minutes they must pump equal volumes.
Delete the atrial kick and see who notices. At rest, almost nobody does, because about 80 percent of filling was passive anyway. Speed the heart up, though, and diastole shrinks until the missing 20 percent starts to matter. That's the logic behind why lost atrial contraction, as in atrial fibrillation, can pass quietly at rest and show up during exertion.
You'll learn this fastest by redrawing Figure 1 from memory with pressure, volume, ECG and sound stacked on one time axis. A 2014 paper in Advances in Physiology Education by Mitchell and Wang makes the case that this one stacked diagram can be stretched to teach far more than valve timing.
The ECG: an electrical memo that arrives first
Behind every pressure change sits an electrical event. The impulse starts at the SA node, spreads across both atria, pauses at the AV node, then races into the ventricles, so the atria contract together and then the two ventricles do. The surface ECG records that voltage story from the skin. It tracks electricity, and the squeeze itself never appears on it.
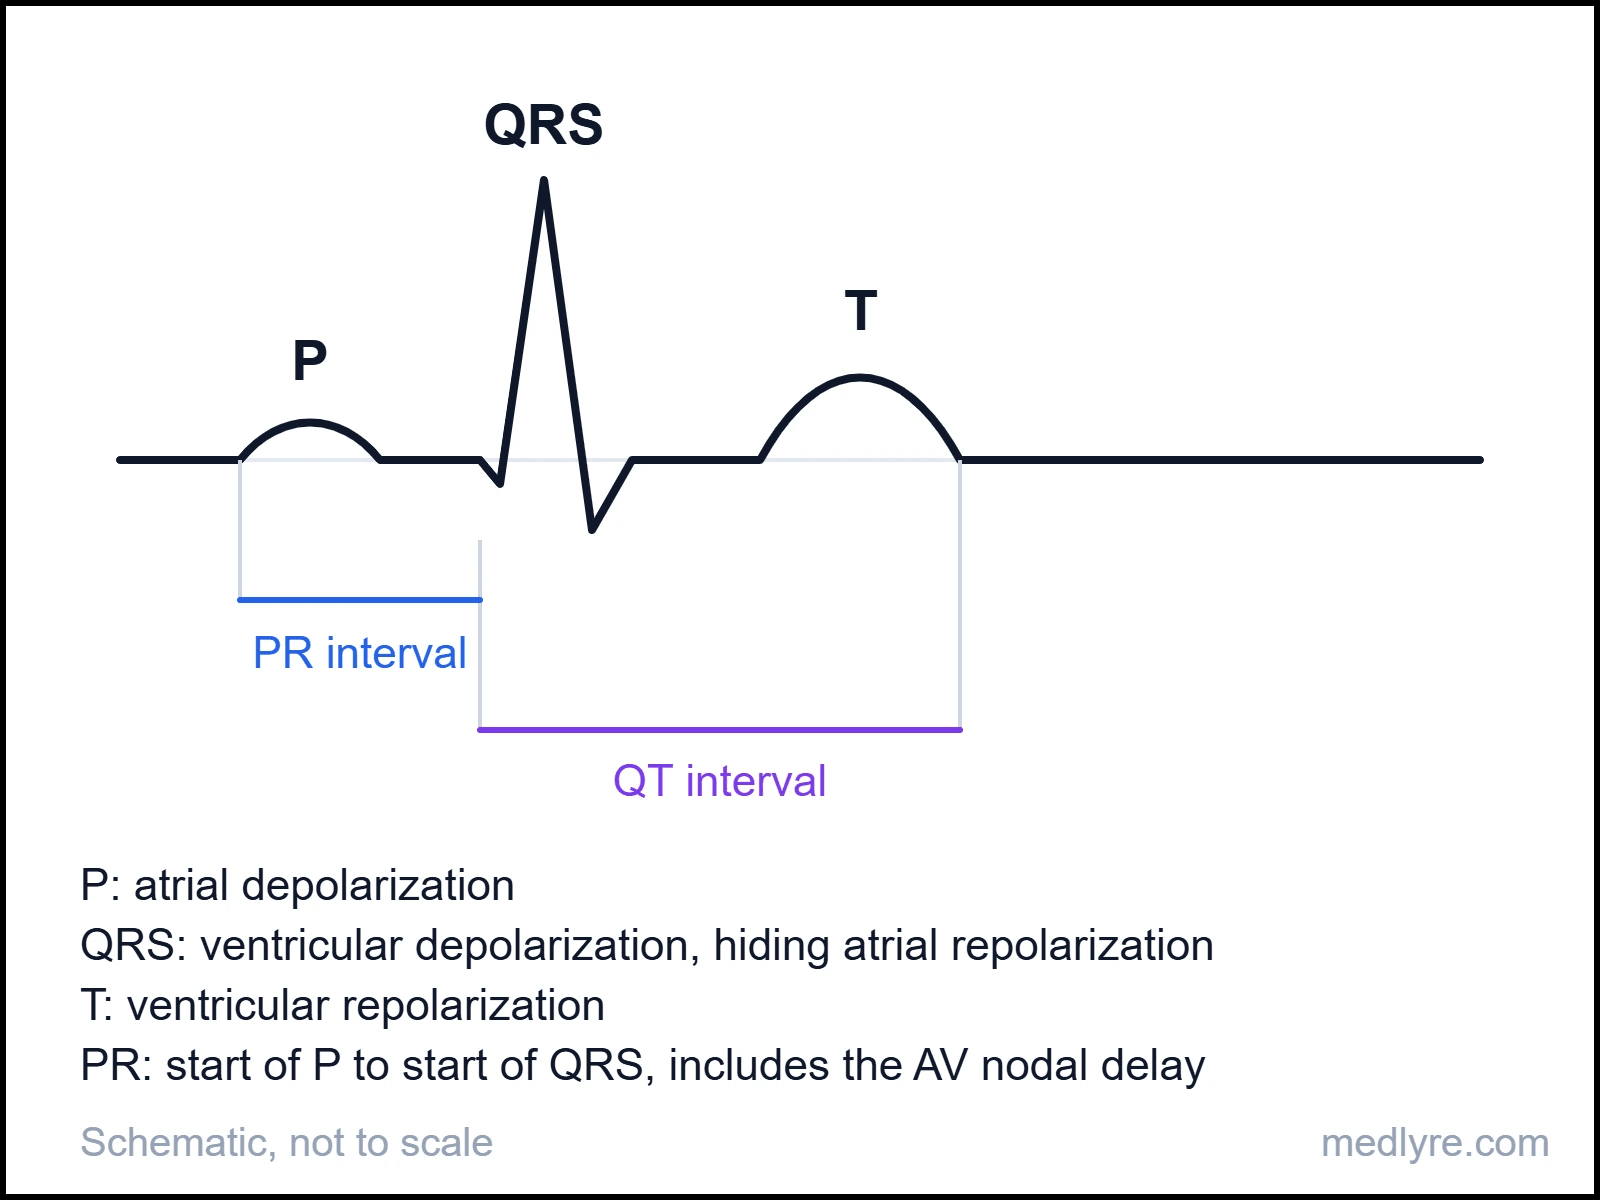
Three deflections do most of the talking. The P wave is atrial depolarization. The QRS is ventricular depolarization, and it buries atrial repolarization underneath it because the ventricles' signal is so much larger. The T wave is ventricular repolarization. The flat stretch between P and QRS is the AV nodal delay, the pause that lets the ventricles finish filling before they fire.
You're probably wondering why the T wave points upward when repolarization is the reverse of depolarization. The order flips as well: in standard textbook accounts, the epicardium, which depolarized last, repolarizes first. Two reversals, one sign.
| Measure | Typical normal | What it reflects |
|---|---|---|
| PR interval | 0.12 to 0.20 s | AV nodal conduction |
| QRS duration | under 0.12 s | Spread through the ventricles |
| QT interval | about 0.35 to 0.44 s at usual rates | Total ventricular electrical activity |
Limits differ slightly between textbooks, and QT changes with heart rate, so quote the numbers your own syllabus prints. For rate, remember the paper-speed shortcut: at the standard speed one large box is 0.2 second, so heart rate is 300 divided by the number of large boxes between two R waves (valid for regular rhythms only).
The QRS comes before S1 and before the pressure rise, because depolarization leads contraction by a short lag. The T wave lands in the closing stretch of ejection, which is why it lines up with phase C in the table above.
Why this shows up in clinic
Electrical activity is a trigger and gives no guarantee of output. In pulseless electrical activity the monitor shows organized electrical beats while the ventricle fails to deliver effective flow, which is why pulse and pressure are always read alongside the tracing.
From output to pressure: one multiplication, one pinch
A beat is a pressure event. A minute of beats is a flow, and that flow is where the next equation lives.
Cardiac output: three dials, one product
Cardiac output (CO) is the volume one ventricle ejects per minute: . At rest, about 70 beats times 70 ml gives roughly 5 L/min, close to the entire blood volume passing through the heart every minute.
Heart rate has two hands on the dial. Sympathetic nerves speed the SA node and vagal fibres slow it, and at rest the vagus wins, which is why a normal resting rate sits well below the SA node's own intrinsic rhythm of about 100 per minute.
Stroke volume has three dials of its own. A StatPearls entry on mean arterial pressure outlines them: contractility and preload push stroke volume up, and a rise in afterload pulls it down.
| Dial | What it means | Raise it and stroke volume... |
|---|---|---|
| Preload | Stretch on the ventricle at the end of filling, set by venous return | rises, through the Frank-Starling mechanism |
| Contractility | Force the muscle produces at a given stretch, lifted by sympathetic input and more available calcium | rises |
| Afterload | The load the ventricle works against during ejection, estimated clinically by aortic pressure and vascular resistance | falls |
Pull a rubber band back further and it flies harder. Heart muscle behaves similarly within limits: more filling stretches the sarcomeres and the next beat is stronger. This Frank-Starling mechanism keeps the two ventricles matched beat by beat, because whatever the right side delivers becomes the left side's preload. Honestly, I'd rank it as the highest-yield idea in the whole chapter.
Does a faster heart always mean more output? Up to a point. Suppose a resting heart hit 200 beats per minute with nothing else changed. The cycle would last 0.3 second, systole would claim most of it, and diastole would shrink to a sliver of filling time. Stroke volume would fall so hard that output drops despite the extra beats.
Pressure: where flow meets resistance
Flow alone makes very little pressure. Push 5 L/min through wide-open pipes and pressure stays low; squeeze the pipes and it climbs. So , and resistance depends on vessel radius to the fourth power. Halve an arteriole's radius and resistance rises sixteen-fold, which is why the body steers pressure largely by squeezing and relaxing arterioles.
Mean pressure is not the midpoint of 120 and 80. Diastole lasts longer than systole at normal rates, so the average sits nearer the diastolic value: . For 120/80 that gives 80 plus 13.3, about 93 mmHg. The same formula appears in the StatPearls mean arterial pressure entry, with pulse pressure standing in for SP minus DP.
Pulse pressure tracks stroke volume against arterial stiffness. Stiffen the aorta, as aging does, and the same stroke volume pushes systolic higher and lets diastolic sag, so the gap widens. Capillaries hold the largest combined cross-section in the circulation, so flow through them is slowest, which suits an exchange surface.
| Parameter | Typical value at rest | Note |
|---|---|---|
| Heart rate | 60 to 100 per min | Trained athletes sit lower |
| End-diastolic volume | about 120 ml | Left ventricle |
| End-systolic volume | about 50 ml | What stays behind |
| Stroke volume | about 70 ml | EDV minus ESV |
| Ejection fraction | about 60 percent | SV divided by EDV |
| Cardiac output | about 5 L/min | HR times SV |
| Aortic pressure | 120/80 mmHg | MAP about 93 |
| Pulmonary artery pressure | about 25/10 mmHg | Right ventricle's load |
| Mean right atrial pressure | 4 to 5 mmHg | Rises when the right heart backs up |
Something watches those pressures on every beat.
Who fixes the pressure when you stand up?
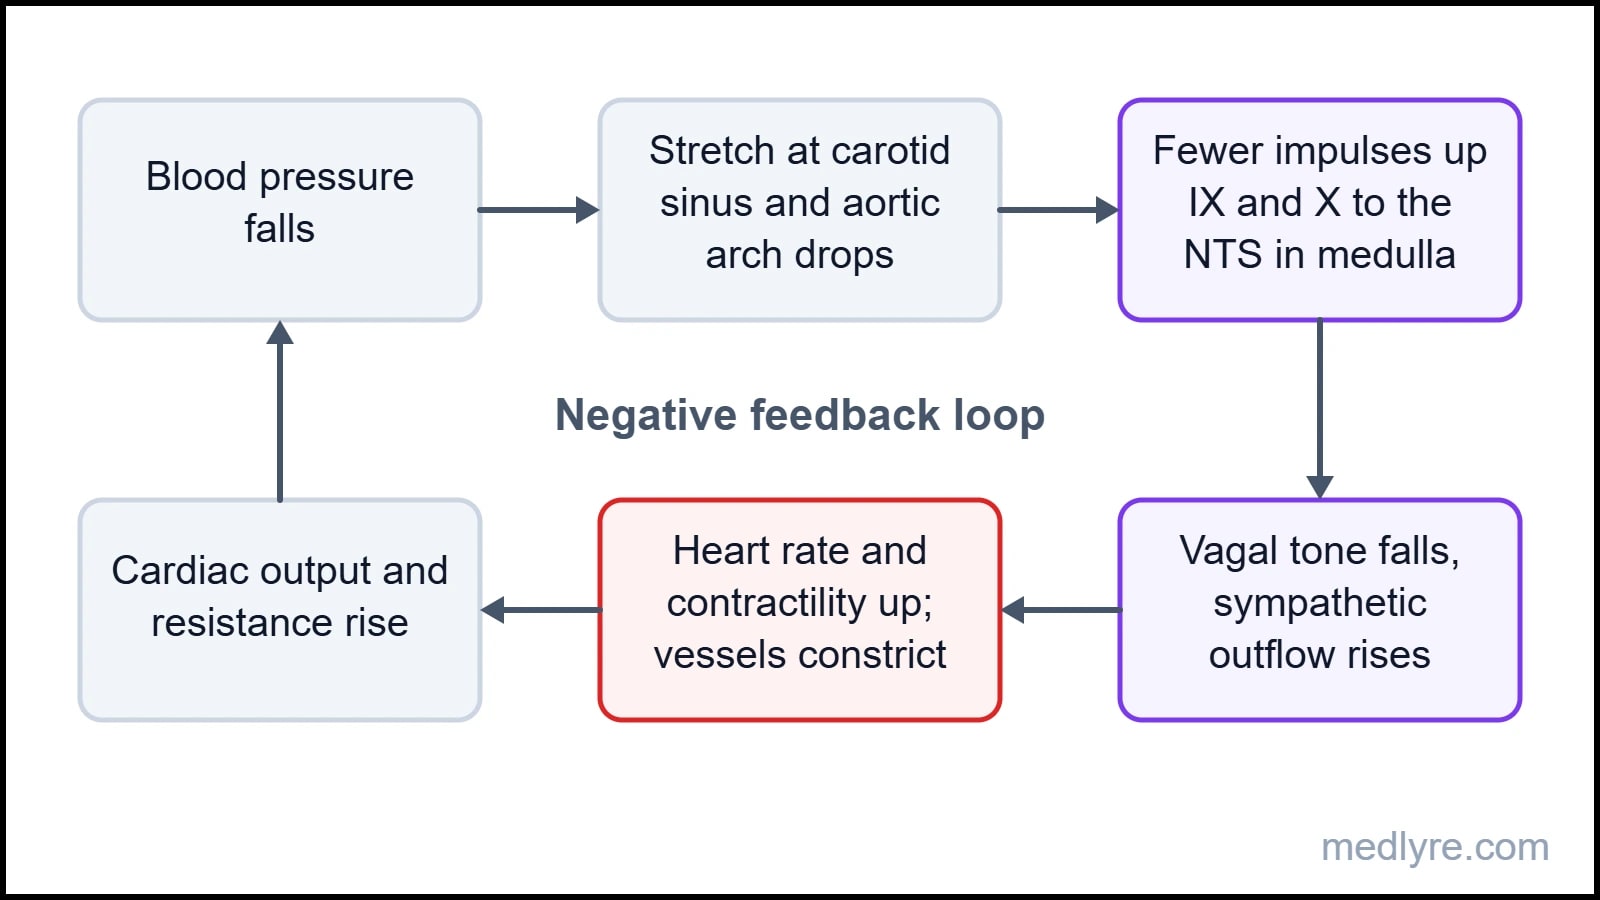
The baroreflex. Arterial baroreceptors are stretch sensors in the carotid sinus and the aortic arch, and they fire faster when the wall stretches more. The carotid sinus reports through the glossopharyngeal nerve (IX), the aortic arch through the vagus (X), and both land on the nucleus tractus solitarius (NTS) in the medulla, as the StatPearls baroreceptor chapter sets out.
Higher pressure means more firing, and more firing makes the NTS inhibit the tonically active sympathetic outflow while vagal outflow rises. The heart slows, vessels dilate, pressure falls. Lower pressure reverses every step. The first time I saw this reflex drawn as a loop, I wondered why the NTS box sat in the middle like a switchboard. It is a switchboard.
Here is what your body did when you stood up:
- Gravity pooled roughly half a liter or more of blood in the leg veins.
- Venous return fell, so preload, stroke volume and cardiac output fell, and pressure at the carotid sinus dipped.
- Stretch on the receptors dropped and firing slowed.
- The NTS stopped braking the sympathetic outflow, and vagal tone eased off.
- Heart rate and contractility rose, arterioles constricted, and veins constricted too, squeezing blood back toward the heart.
- Pressure recovered within seconds, firing returned to its usual rate, and the loop went quiet.
Receptors differ in personality. The same chapter splits carotid fibres into type 1 dynamic receptors, carried on large myelinated A-fibres, and type 2 tonic receptors, carried on small A-fibres and unmyelinated C-fibres. A second set sits in the atria, ventricles and pulmonary vessels. These cardiopulmonary receptors sense volume more than pressure, which makes them an early warning that the circulating volume is falling.
Can the baroreflex correct sustained high blood pressure? It buffers minute-to-minute swings, but when pressure stays high the receptors reset to the new level and stop pushing it down. Guyton and Hall hand long-term control to the kidneys, which adjust salt and water excretion until pressure returns to its set point.
Carotid sinus massage works because outside pressure on the sinus mimics high arterial pressure, so firing rises and vagal tone follows. A StatPearls review of vagal maneuvers lists it beside the Valsalva maneuver and the diving reflex as techniques used in supraventricular tachycardia, always as a supervised clinical procedure.
Now break the system on purpose.
When blood leaves faster than it comes back
A bleed attacks the same equation from the volume side. Less blood means less venous return, so preload falls, stroke volume falls, cardiac output falls and pressure follows. Everything the body does next is an attempt to hold steady.
The response runs on three clocks. The baroreflex acts in seconds. Within minutes, circulating catecholamines, ADH and the renin-angiotensin system add vasoconstriction and water conservation. Over hours, falling capillary hydrostatic pressure pulls interstitial fluid into the vessels, which refills the volume slowly from the tissues.
flowchart TD
A["Blood loss"] --> B["Venous return falls"]
B --> C["Stroke volume falls (Frank-Starling)"]
C --> D["Cardiac output and MAP fall"]
D --> E["Baroreceptor firing falls"]
E --> F["Sympathetic up, vagal down"]
F --> G["Faster heart, arteriolar and venous constriction"]
G -->|"pushes pressure back up"| D
D -->|"minutes to hours"| H["ADH, RAAS, fluid shift into capillaries"]
Figure 4: The cascade from blood loss to compensation, with the baroreflex loop closing back on output.
Pale, cool skin and slow capillary refill show up early. The StatPearls hemorrhagic shock chapter links cool extremities and delayed refill to peripheral vasoconstriction, and the logic is triage: skin, gut and kidney are squeezed first so that blood keeps flowing to the brain and heart.
Pulse pressure narrows early for a mechanical reason. Vasoconstriction lifts diastolic pressure while a smaller stroke volume blunts the systolic rise, so the gap shrinks before the headline pressure moves.
| ATLS class | Blood loss | Heart rate | Blood pressure | Pulse pressure | Mental state |
|---|---|---|---|---|---|
| I | under 15% | Normal | Normal | Normal or raised | Normal |
| II | 15 to 30% | Normal to raised | Normal | Narrowed | Mildly anxious |
| III | 30 to 40% | Raised | Normal to low | Narrowed | Anxious, confused |
| IV | over 40% | Markedly raised | Low | Narrowed | Confused, lethargic |
That table raises the question every student asks: how can pressure be normal in someone who has already lost a quarter of their blood? Falling blood pressure is a late sign in hemorrhage, because compensation spends everything it has to hold pressure steady.
The trap in the table
The classes are built around a healthy 70 kg adult, and real patients bend them. The hemorrhagic shock chapter notes that compensation varies with cardiopulmonary disease, age and vasoactive medicines, and that elderly patients tolerate shock poorly and can decompensate sooner. Beta-blockers, athletic conditioning and some vagal responses can blunt or even reverse the expected tachycardia. Treat the table as a map of the logic, with the numbers as approximate. Management belongs in your trauma curriculum, not in this article.
Exercise, or the circuit at full stretch
You're probably wondering whether you have to memorize all of this separately. You don't, because exercise is the one stress the whole system was built for, and it runs every equation above at once. Oxygen demand rises, so output must rise, so heart rate and stroke volume rise while resistance is steered to keep pressure useful.
The order of events starts upstairs. Signals from motor areas of the brain and from working muscle shift autonomic balance at the very start of exercise. Vagal withdrawal produces the first rise in heart rate, up to roughly the SA node's own rhythm, and sympathetic drive carries it beyond that.
Meanwhile working muscle announces its own needs. Local metabolites such as potassium, hydrogen ions, carbon dioxide and adenosine dilate its arterioles, a response called active hyperemia, while sympathetic constriction narrows the gut and kidneys. Total peripheral resistance falls, because the largest vascular bed in the body just opened.
Venous return climbs at the same time, helped by the muscle pump, the respiratory pump and venoconstriction, so Frank-Starling lifts stroke volume. In many untrained people stroke volume plateaus fairly early, and heart rate carries the rest of the rise. Standard physiology texts put peak output around 20 to 25 L/min in a healthy untrained adult and 30 or more in elite endurance athletes.
Oxygen uptake ties it together through the Fick principle: . Exercise physiology texts such as McArdle, Katch and Katch use this relation throughout, and it shows that muscle gets more oxygen by two routes: more blood per minute, and more oxygen extracted from each liter.
Pressure behaves in a way that surprises people. In dynamic exercise, systolic pressure rises while diastolic holds steady or dips, because falling resistance in muscle offsets the surge in output, and mean pressure climbs only modestly. Sustained static effort, such as gripping hard, compresses vessels, triggers a strong pressor reflex and raises both numbers.
Peak heart rate falls with age, and 220 minus age is the familiar rough estimate. Individuals scatter by around 10 beats per minute either way, so it is a guide and nothing more. Endurance training raises stroke volume, which lets resting heart rate drop, and that is the reason well-trained athletes often sit in the 40s or 50s.
One last mechanism closes the loop with where we started. If exercise stops abruptly, the muscle pump stops with it while leg vessels stay dilated, blood pools, and pressure can dip. That is the physiology behind graded cool-downs.
The ninety-second chain
Cardiovascular physiology collapses into one chain once you've seen it whole. Say it out loud before you open the exam paper.
Start to finish, in one breath
- Cycle: five phases, two all-valves-shut stretches, S1 closes the mitral and S2 closes the aortic valve.
- ECG: P is atria, QRS is ventricles, T is repolarization. Electricity leads contraction, and heart rate is 300 divided by large boxes.
- Output: , about 5 L/min. Preload, contractility and afterload steer stroke volume, and Starling matches the two sides.
- Pressure: . Resistance scales with 1/r4, so arterioles are the steering wheel. MAP is DP plus a third of pulse pressure.
- Baroreflex: IX and X into the NTS. Less firing means more sympathetic, less vagal. It wins in seconds, and the kidneys own the long game.
- Hemorrhage and exercise: a bleed drops preload and the same reflex fights back, so low BP arrives late. Exercise opens muscle arterioles, so output multiplies while pressure rises modestly.
Questions that keep coming back after the lecture
Q. Why does the ventricle need isovolumic phases at all?
Because pressure has to cross a threshold before any door opens. During contraction the ventricle must first exceed aortic pressure, and during relaxation it must first fall below atrial pressure. Those stretches with all valves shut are the time spent building or shedding pressure, and they explain why S1 and S2 mark the edges of systole.
Q. Do the right and left ventricles pump the same output?
In steady state, yes, because they sit in series and any mismatch would pile fluid up in one circuit within minutes. Small differences exist, since a little bronchial and Thebesian venous blood drains straight into the left side, but the Frank-Starling mechanism corrects beat-to-beat mismatches. Pressures differ enormously, flows do not.
Q. What's the fastest way to calculate MAP in an exam?
Take diastolic pressure and add one third of the pulse pressure. For 120/80, pulse pressure is 40, one third is about 13, and MAP is about 93 mmHg. The shortcut works because diastole takes up about two thirds of the cycle at normal rates, so the average leans toward the diastolic value.
Q. Does the baroreflex control long-term hypertension?
It buffers short-term swings but resets to the prevailing pressure when pressure stays high. Long-term control is usually assigned to the kidneys, which change sodium and water excretion until pressure returns to its set point. If an exam asks which system sets the long-term level, answer kidneys, with the baroreflex covering seconds to minutes.
Q. Why can an ECG look organized when there is no pulse?
The ECG records electrical activity, and contraction needs additional steps: calcium handling, coordinated fibre shortening, and adequate filling. In pulseless electrical activity the electrical beats continue while the mechanical output fails. This is the standard example of why electrical and mechanical function need separate checks.
Q. Why does diastolic pressure stay flat in exercise while systolic climbs?
Stroke volume and ejection force rise, which lifts systolic pressure. At the same time, working-muscle arterioles dilate, which lowers total peripheral resistance and keeps diastolic pressure from rising. The net effect is a wider pulse pressure and a modest rise in mean pressure. Static exercise differs, because sustained contraction compresses vessels and raises both numbers.
For students, not patients
Everything in this article exists to help students understand a topic they struggle with. It is not a treatment guide, not a clinical protocol, and not a substitute for the curriculum your institution follows. Bedside decisions always need qualified supervision and full patient assessment.
References
- Pollock JD, Makaryus AN. "Physiology, Cardiac Cycle." In: StatPearls [Internet]. Treasure Island (FL): StatPearls Publishing. PMID 29083687. Direct URL.
- Mitchell JR, Wang JJ. "Expanding application of the Wiggers diagram to teach cardiovascular physiology." Advances in Physiology Education. 2014;38(2). doi.1152/advan.00123.2013. PMID 24913453. Direct URL.
- "Physiology, Mean Arterial Pressure." In: StatPearls [Internet]. Treasure Island (FL): StatPearls Publishing. Direct URL.
- "Physiology, Baroreceptors." In: StatPearls [Internet]. Treasure Island (FL): StatPearls Publishing. Direct URL.
- "Vagal Maneuvers." In: StatPearls [Internet]. Treasure Island (FL): StatPearls Publishing. Direct URL.
- "Hemorrhagic Shock." In: StatPearls [Internet]. Treasure Island (FL): StatPearls Publishing. Direct URL.
- Hall JE, Hall ME. Guyton and Hall Textbook of Medical Physiology. 14th ed. Elsevier; 2021.
- McArdle WD, Katch FI, Katch VL. Exercise Physiology: Nutrition, Energy, and Human Performance. 8th ed. Wolters Kluwer; 2014.